Netgear GS728TXS GS728TXS/GS752TXS Software Administration Manual - Page 264
IP Address Type, Severity Filter
 |
View all Netgear GS728TXS manuals
Add to My Manuals
Save this manual to your list of manuals |
Page 264 highlights
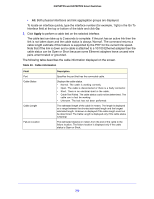
GS752TXS and GS728TXS Smart Switches The Server Log Configuration area displays the following information: • The Messages Received field shows the number of messages received by the log process. This includes messages that are dropped or ignored. • The Messages Relayed field shows the number of messages forwarded by the syslog function to a syslog host. Messages forwarded to multiple hosts are counted once for each host. • The Messages Ignored field shows the number of messages that were ignored. To add a remote syslog host (log server): 1. Specify the following settings in the following list. • IP Address Type. Specify the IP Address Type of Host. It can be one of the following: - IPv4 - IPv6 - DNS • Host Address. Specify the hostname of the host configured for syslog. • Port. Specify the port on the host to which syslog messages are sent. The default port is 514. • Severity Filter. Use the menu to select the severity of the logs to send to the logging host. Logs with the selected severity level and all logs of greater severity are sent to the host. For example, if you select Error, the logged messages include Error, Critical, Alert, and Emergency. The default severity level is Alert (1). The severity can be one of the following levels: - Emergency (0). The highest warning level. If the device is down or not functioning properly, an emergency log is saved to the device. - Alert (1). The second highest warning level. An alert log is saved if there is a serious device malfunction, such as all device features being down. - Critical (2). The third highest warning level. A critical log is saved if a critical device malfunction occurs, for example, two device ports are not functioning, while the rest of the device ports remain functional. - Error (3). A device error has occurred, such as if a port is offline. - Warning (4). The lowest level of a device warning. - Notice (5). Provides the network administrators with device information. - Informational (6). Provides device information. - Debug (7). Provides detailed information about the log. Debugging should only be entered by qualified support personnel. 2. Click Add. The Status field in the Server Configuration table shows whether the remote logging host is currently active. 264
-
 1
1 -
2
-
3
-
4
-
5
-
6
-
7
-
8
-
9
-
10
-
11
-
12
-
13
-
14
-
15
-
16
-
17
-
18
-
19
-
20
-
21
-
22
-
23
-
24
-
25
-
26
-
27
-
28
-
29
-
30
-
31
-
32
-
33
-
34
-
35
-
36
-
37
-
38
-
39
-
40
-
41
-
42
-
43
-
44
-
45
-
46
-
47
-
48
-
49
-
50
-
51
-
52
-
53
-
54
-
55
-
56
-
57
-
58
-
59
-
60
-
61
-
62
-
63
-
64
-
65
-
66
-
67
-
68
-
69
-
70
-
71
-
72
-
73
-
74
-
75
-
76
-
77
-
78
-
79
-
80
-
81
-
82
-
83
-
84
-
85
-
86
-
87
-
88
-
89
-
90
-
91
-
92
-
93
-
94
-
95
-
96
-
97
-
98
-
99
-
100
-
101
-
102
-
103
-
104
-
105
-
106
-
107
-
108
-
109
-
110
-
111
-
112
-
113
-
114
-
115
-
116
-
117
-
118
-
119
-
120
-
121
-
122
-
123
-
124
-
125
-
126
-
127
-
128
-
129
-
130
-
131
-
132
-
133
-
134
-
135
-
136
-
137
-
138
-
139
-
140
-
141
-
142
-
143
-
144
-
145
-
146
-
147
-
148
-
149
-
150
-
151
-
152
-
153
-
154
-
155
-
156
-
157
-
158
-
159
-
160
-
161
-
162
-
163
-
164
-
165
-
166
-
167
-
168
-
169
-
170
-
171
-
172
-
173
-
174
-
175
-
176
-
177
-
178
-
179
-
180
-
181
-
182
-
183
-
184
-
185
-
186
-
187
-
188
-
189
-
190
-
191
-
192
-
193
-
194
-
195
-
196
-
197
-
198
-
199
-
200
-
201
-
202
-
203
-
204
-
205
-
206
-
207
-
208
-
209
-
210
-
211
-
212
-
213
-
214
-
215
-
216
-
217
-
218
-
219
-
220
-
221
-
222
-
223
-
224
-
225
-
226
-
227
-
228
-
229
-
230
-
231
-
232
-
233
-
234
-
235
-
236
-
237
-
238
-
239
-
240
-
241
-
242
-
243
-
244
-
245
-
246
-
247
-
248
-
249
-
250
-
251
-
252
-
253
-
254
-
255
-
256
-
257
-
258
-
 259
259 -
 260
260 -
 261
261 -
 262
262 -
 263
263 -
 264
264 -
 265
265 -
 266
266 -
 267
267 -
 268
268 -
 269
269 -
270
-
271
-
272
-
273
-
274
-
275
-
276
-
277
-
278
-
279
-
280
-
281
-
282
-
283
-
284
-
285
-
286
-
287
-
288
-
289
-
290
-
291
-
292
-
293
-
294
-
295
-
296
-
297
-
298
-
299
-
300
-
301
-
302
-
303
-
304
-
305
-
306
-
307
-
308
-
309
-
310
-
311
-
312
-
313
-
314
-
315
-
316
-
317
-
318
-
319
-
320
-
321
-
322
-
323
-
324
 |
 |
