Sharp EL-9900 EL-9900C - Page 75
The graph for Y1 = 2X
 |
UPC - 074000016880
View all Sharp EL-9900 manuals
Add to My Manuals
Save this manual to your list of manuals |
Page 75 highlights
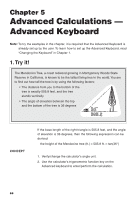
Chapter 4: Basic Graphing Features - Basic Keyboard 2. Press 2 E. (2 is input to A.) The graph for "Y1 = 2X2" is drawn. (Since B and C have no values, they are ignored.) At this time, the graph for Y2 is also drawn. Y2 also uses variable A which is used in Y1. Therefore, the drawing of the graph for Y2 is also valid. * If you need to draw only the graph for Y2, it is necessary to change variables (characters) or make the graph drawing for Y1 invalid. 3. Press 1 E. (1 is input to B.) The graph is changed from "Y1 = 2X2" to "Y1 = 2X2 + 1X". 4. Press _ 3 E. (-3 is input to C.) Now, the graph for "Y1 = 2X2 + 1X - 3" is drawn on the screen. Next, change variable A from 2 to 5 and see how the graph changes. 1. Press { { 5 E. (The cursor is moved from C to A and 5 is input.) The slope of the graph becomes sharp. * Move the cursor accordingly and substitute other numeric values for variables to view how the graph changes. * The trace function cannot be used in the substitution feature. (When U is pressed, the full-screen graph will appear.) 65
-
 1
1 -
2
-
3
-
4
-
5
-
6
-
7
-
8
-
9
-
10
-
11
-
12
-
13
-
14
-
15
-
16
-
17
-
18
-
19
-
20
-
21
-
22
-
23
-
24
-
25
-
26
-
27
-
28
-
29
-
30
-
31
-
32
-
33
-
34
-
35
-
36
-
37
-
38
-
39
-
40
-
41
-
42
-
43
-
44
-
45
-
46
-
47
-
48
-
49
-
50
-
51
-
52
-
53
-
54
-
55
-
56
-
57
-
58
-
59
-
60
-
61
-
62
-
63
-
64
-
65
-
66
-
67
-
68
-
69
-
 70
70 -
 71
71 -
 72
72 -
 73
73 -
 74
74 -
 75
75 -
 76
76 -
 77
77 -
 78
78 -
 79
79 -
 80
80 -
81
-
82
-
83
-
84
-
85
-
86
-
87
-
88
-
89
-
90
-
91
-
92
-
93
-
94
-
95
-
96
-
97
-
98
-
99
-
100
-
101
-
102
-
103
-
104
-
105
-
106
-
107
-
108
-
109
-
110
-
111
-
112
-
113
-
114
-
115
-
116
-
117
-
118
-
119
-
120
-
121
-
122
-
123
-
124
-
125
-
126
-
127
-
128
-
129
-
130
-
131
-
132
-
133
-
134
-
135
-
136
-
137
-
138
-
139
-
140
-
141
-
142
-
143
-
144
-
145
-
146
-
147
-
148
-
149
-
150
-
151
-
152
-
153
-
154
-
155
-
156
-
157
-
158
-
159
-
160
-
161
-
162
-
163
-
164
-
165
-
166
-
167
-
168
-
169
-
170
-
171
-
172
-
173
-
174
-
175
-
176
-
177
-
178
-
179
-
180
-
181
-
182
-
183
-
184
-
185
-
186
-
187
-
188
-
189
-
190
-
191
-
192
-
193
-
194
-
195
-
196
-
197
-
198
-
199
-
200
-
201
-
202
-
203
-
204
-
205
-
206
-
207
-
208
-
209
-
210
-
211
-
212
-
213
-
214
-
215
-
216
-
217
-
218
-
219
-
220
-
221
-
222
-
223
-
224
-
225
-
226
-
227
-
228
-
229
-
230
-
231
-
232
-
233
-
234
-
235
-
236
-
237
-
238
-
239
-
240
-
241
-
242
-
243
-
244
-
245
-
246
-
247
-
248
-
249
-
250
-
251
-
252
-
253
-
254
-
255
-
256
-
257
-
258
-
259
-
260
-
261
-
262
-
263
-
264
-
265
-
266
-
267
-
268
-
269
-
270
-
271
-
272
-
273
-
274
-
275
-
276
-
277
-
278
-
279
-
280
-
281
-
282
-
283
-
284
 |
 |
