Sharp EL-9900 EL-9900C - Page 101
unMin, Example 2: Phase-based Graphing uv, FORMAT, G TYPE
 |
UPC - 074000016880
View all Sharp EL-9900 manuals
Add to My Manuals
Save this manual to your list of manuals |
Page 101 highlights
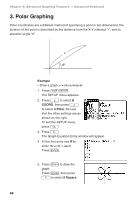
Chapter 6: Advanced Graphing Features - Advanced Keyboard 4. Now, go to the Graph Equation Entry window by pressing Y. The cursor is set at the first line u(n); pressing C will clear any previous entry, as well as to put the cursor at the right side of the equation. 5. Enter 2 × 2n-1. Use the X key to enter n. When done, press E. The cursor moves down to the second row. 6. In the entry area u(nMin)=, enter the minimum value of the n, 1, then press E. 7. Press the G key. 8. Press Z, then press 1 to select 1 Auto (automatic zoom). 9. Press the U key, then use the ' key to trace the graph. Example 2: Phase-based Graphing (uv) • Compare 2 × 0.9n-1 with the previously entered sequence. Phase-based graphing requires a set of two sequential equations. Since we already have one entered as above, we will create another one here, but first the sequential graph format will need to be set to uv. 1. Press @ f to enter the FORMAT menu, then press G to select G TYPE. 2. Select uv by pressing 3. 3. Press Y to go to the Graph Equation Entry window. 91
-
 1
1 -
2
-
3
-
4
-
5
-
6
-
7
-
8
-
9
-
10
-
11
-
12
-
13
-
14
-
15
-
16
-
17
-
18
-
19
-
20
-
21
-
22
-
23
-
24
-
25
-
26
-
27
-
28
-
29
-
30
-
31
-
32
-
33
-
34
-
35
-
36
-
37
-
38
-
39
-
40
-
41
-
42
-
43
-
44
-
45
-
46
-
47
-
48
-
49
-
50
-
51
-
52
-
53
-
54
-
55
-
56
-
57
-
58
-
59
-
60
-
61
-
62
-
63
-
64
-
65
-
66
-
67
-
68
-
69
-
70
-
71
-
72
-
73
-
74
-
75
-
76
-
77
-
78
-
79
-
80
-
81
-
82
-
83
-
84
-
85
-
86
-
87
-
88
-
89
-
90
-
91
-
92
-
93
-
94
-
95
-
 96
96 -
 97
97 -
 98
98 -
 99
99 -
 100
100 -
 101
101 -
 102
102 -
 103
103 -
 104
104 -
 105
105 -
 106
106 -
107
-
108
-
109
-
110
-
111
-
112
-
113
-
114
-
115
-
116
-
117
-
118
-
119
-
120
-
121
-
122
-
123
-
124
-
125
-
126
-
127
-
128
-
129
-
130
-
131
-
132
-
133
-
134
-
135
-
136
-
137
-
138
-
139
-
140
-
141
-
142
-
143
-
144
-
145
-
146
-
147
-
148
-
149
-
150
-
151
-
152
-
153
-
154
-
155
-
156
-
157
-
158
-
159
-
160
-
161
-
162
-
163
-
164
-
165
-
166
-
167
-
168
-
169
-
170
-
171
-
172
-
173
-
174
-
175
-
176
-
177
-
178
-
179
-
180
-
181
-
182
-
183
-
184
-
185
-
186
-
187
-
188
-
189
-
190
-
191
-
192
-
193
-
194
-
195
-
196
-
197
-
198
-
199
-
200
-
201
-
202
-
203
-
204
-
205
-
206
-
207
-
208
-
209
-
210
-
211
-
212
-
213
-
214
-
215
-
216
-
217
-
218
-
219
-
220
-
221
-
222
-
223
-
224
-
225
-
226
-
227
-
228
-
229
-
230
-
231
-
232
-
233
-
234
-
235
-
236
-
237
-
238
-
239
-
240
-
241
-
242
-
243
-
244
-
245
-
246
-
247
-
248
-
249
-
250
-
251
-
252
-
253
-
254
-
255
-
256
-
257
-
258
-
259
-
260
-
261
-
262
-
263
-
264
-
265
-
266
-
267
-
268
-
269
-
270
-
271
-
272
-
273
-
274
-
275
-
276
-
277
-
278
-
279
-
280
-
281
-
282
-
283
-
284
 |
 |
