Garmin GPSMAP 188C Owners Manual - Page 24
returns lighter. The 'Fish Symbols' option see allows you to view the actual sonar data, - transducer
 |
UPC - 753759031923
View all Garmin GPSMAP 188C manuals
Add to My Manuals
Save this manual to your list of manuals |
Page 24 highlights
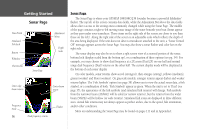
Getting Started Sonar Page Data Fields Simulated Fish Arch Bottom Whiteline Thermocline Sonar Page Adjustment Menu Depth Scale Outer edge beam returns Center beam return Frequency mode 14 Dual frequency returns Flasher Sonar Page The Sonar Page is where your GPSMAP 188/188C/238 Sounder becomes a powerful fishfinder/ flasher. The top left of the screen contains data fields, while the Adjustment Bar above the data fields allows direct access to the settings most commonly changed while using the Sonar Page. The middle of the page contains a right-to-left moving sonar image of the water beneath your boat (Items appear as they pass under your transducer. Those items on the right side of the screen are closer to you than those on the left.). Along the right side of the screen is an adjustable scale which reflects the depth of the area being displayed. If the unit does not detect a transducer attached to the unit, a "Sonar Turned Off" message appears across the Sonar Page. You may also show a sonar flasher and color bar on the right side. The sonar display may also be set to show a split screen view of a zoomed portion of the sonar, bottom lock (display scaled from the bottom up), or a combination of these options (see pg. 34). For example, you may choose to show dual frequency at a 2X zoom (Dual 2X) on one half and normal range dual frequency (Dual) returns on the other half. The current display mode will be displayed at the bottom of each sonar display. On color models, sonar returns show as red (strongest), then oranges (strong), yellows (medium), greens (weaker) and blues (weakest). On grayscale models, stronger returns appear darker and weaker returns lighter. The 'Fish Symbols' option (see page 38) allows you to view the actual sonar data, a fish symbol, or a combination of both. 'Fish Symbols' appear as green. When the unit is set to 'Dual' (see page 35), the appearance of the fish symbols (and simulated fish returns) will change. Fish symbols from the narrower beam (200kHz) will be solid (or narrow returns), but the returns from the wider beam (50kHz) will be hollow (or wide returns). Simulated fish icons are displayed in three different sizes. Actual fish returns may not always appear as perfect arches, due to the speed, fish orientation, and/or other conditions. More on understanding the Sonar Page may be found on pages 111 and in Appendix I.
-
 1
1 -
2
-
3
-
4
-
5
-
6
-
7
-
8
-
9
-
10
-
11
-
12
-
13
-
14
-
15
-
16
-
17
-
18
-
 19
19 -
 20
20 -
 21
21 -
 22
22 -
 23
23 -
 24
24 -
 25
25 -
 26
26 -
 27
27 -
 28
28 -
 29
29 -
30
-
31
-
32
-
33
-
34
-
35
-
36
-
37
-
38
-
39
-
40
-
41
-
42
-
43
-
44
-
45
-
46
-
47
-
48
-
49
-
50
-
51
-
52
-
53
-
54
-
55
-
56
-
57
-
58
-
59
-
60
-
61
-
62
-
63
-
64
-
65
-
66
-
67
-
68
-
69
-
70
-
71
-
72
-
73
-
74
-
75
-
76
-
77
-
78
-
79
-
80
-
81
-
82
-
83
-
84
-
85
-
86
-
87
-
88
-
89
-
90
-
91
-
92
-
93
-
94
-
95
-
96
-
97
-
98
-
99
-
100
-
101
-
102
-
103
-
104
-
105
-
106
-
107
-
108
-
109
-
110
-
111
-
112
-
113
-
114
-
115
-
116
-
117
-
118
-
119
-
120
-
121
-
122
-
123
-
124
-
125
-
126
-
127
-
128
-
129
-
130
-
131
-
132
-
133
-
134
 |
 |
