D-Link DES-6500 Product Manual - Page 235
Transmitted (TX), Packets, Monitoring
 |
UPC - 790069264580
View all D-Link DES-6500 manuals
Add to My Manuals
Save this manual to your list of manuals |
Page 235 highlights
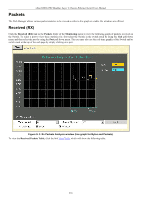
xStack DES-6500 Modular Layer 3 Chassis Ethernet Switch User Manual Transmitted (TX) Click the Transmitted (TX) link in the Packets folder of the Monitoring menu to view the following graph of packets transmitted from the Switch. To select a port to view these statistics for, first select the Switch in the switch stack by using the Unit pull-down menu and then select the port by using the Port pull down menu. The user may also use the real-time graphic of the Switch and/or switch stack at the top of the web page by simply clicking on a port. Figure 9- 7. Tx Packets Analysis window (line graph for Bytes and Packets) To view the Transmitted (TX) Table, click the link View Table, which will show the following table: 220
-
 1
1 -
2
-
3
-
4
-
5
-
6
-
7
-
8
-
9
-
10
-
11
-
12
-
13
-
14
-
15
-
16
-
17
-
18
-
19
-
20
-
21
-
22
-
23
-
24
-
25
-
26
-
27
-
28
-
29
-
30
-
31
-
32
-
33
-
34
-
35
-
36
-
37
-
38
-
39
-
40
-
41
-
42
-
43
-
44
-
45
-
46
-
47
-
48
-
49
-
50
-
51
-
52
-
53
-
54
-
55
-
56
-
57
-
58
-
59
-
60
-
61
-
62
-
63
-
64
-
65
-
66
-
67
-
68
-
69
-
70
-
71
-
72
-
73
-
74
-
75
-
76
-
77
-
78
-
79
-
80
-
81
-
82
-
83
-
84
-
85
-
86
-
87
-
88
-
89
-
90
-
91
-
92
-
93
-
94
-
95
-
96
-
97
-
98
-
99
-
100
-
101
-
102
-
103
-
104
-
105
-
106
-
107
-
108
-
109
-
110
-
111
-
112
-
113
-
114
-
115
-
116
-
117
-
118
-
119
-
120
-
121
-
122
-
123
-
124
-
125
-
126
-
127
-
128
-
129
-
130
-
131
-
132
-
133
-
134
-
135
-
136
-
137
-
138
-
139
-
140
-
141
-
142
-
143
-
144
-
145
-
146
-
147
-
148
-
149
-
150
-
151
-
152
-
153
-
154
-
155
-
156
-
157
-
158
-
159
-
160
-
161
-
162
-
163
-
164
-
165
-
166
-
167
-
168
-
169
-
170
-
171
-
172
-
173
-
174
-
175
-
176
-
177
-
178
-
179
-
180
-
181
-
182
-
183
-
184
-
185
-
186
-
187
-
188
-
189
-
190
-
191
-
192
-
193
-
194
-
195
-
196
-
197
-
198
-
199
-
200
-
201
-
202
-
203
-
204
-
205
-
206
-
207
-
208
-
209
-
210
-
211
-
212
-
213
-
214
-
215
-
216
-
217
-
218
-
219
-
220
-
221
-
222
-
223
-
224
-
225
-
226
-
227
-
228
-
229
-
 230
230 -
 231
231 -
 232
232 -
 233
233 -
 234
234 -
 235
235 -
 236
236 -
 237
237 -
 238
238 -
 239
239 -
 240
240 -
241
-
242
-
243
-
244
-
245
-
246
-
247
-
248
-
249
-
250
-
251
-
252
-
253
-
254
-
255
-
256
-
257
-
258
-
259
-
260
-
261
-
262
-
263
-
264
-
265
-
266
-
267
-
268
-
269
-
270
-
271
-
272
-
273
-
274
-
275
-
276
-
277
-
278
-
279
-
280
-
281
-
282
-
283
-
284
-
285
-
286
-
287
-
288
-
289
-
290
-
291
-
292
-
293
-
294
-
295
-
296
-
297
-
298
-
299
-
300
-
301
-
302
-
303
-
304
-
305
-
306
-
307
-
308
-
309
-
310
-
311
-
312
-
313
-
314
-
315
-
316
-
317
-
318
-
319
-
320
-
321
-
322
-
323
-
324
-
325
-
326
-
327
-
328
-
329
-
330
-
331
-
332
-
333
-
334
-
335
-
336
-
337
-
338
-
339
-
340
-
341
-
342
-
343
-
344
-
345
-
346
-
347
-
348
-
349
-
350
-
351
-
352
-
353
 |
 |

xStack DES-6500 Modular Layer 3 Chassis Ethernet Switch User Manual
Transmitted (TX)
Click the
Transmitted (TX)
link in the
Packets
folder of the
Monitoring
menu to view the following graph of packets
transmitted from the Switch. To select a port to view these statistics for, first select the Switch in the switch stack by using the
Unit
pull-down menu and then select the port by using the Port pull down menu. The user may also use the real-time graphic of
the Switch and/or switch stack at the top of the web page by simply clicking on a port.
Figure 9- 7. Tx Packets Analysis window (line graph for Bytes and Packets)
To view the
Transmitted (TX) Table
, click the link
View Table
, which will show the following table:
220